These sets of data are a great way to understand how your students feel about you and what you need to do to change for the better. I think I will try to understand my 9th grade students more and have discussions with them about what is considered fair or not in order to change those statistics for the better.
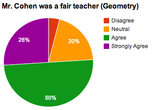
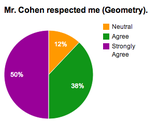
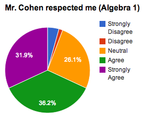
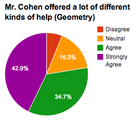
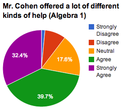
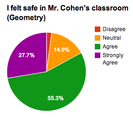
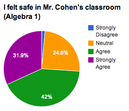
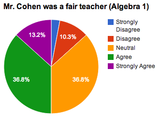
Last year I gave a pretty good end-of-year survey and had students answer a few basic questions about their year. This time I decided to give a much more detailed survey that took some students 15-20 minutes to fill out. I got some really great feedback, divided into quantitative and qualitative. Let's take a look at the quantitative details. Each statement required a rating system including Strongly Disagree, Disagree, Neutral, Agree, and Strongly Agree. I'll analyze a few of the statements in turn: What I find interesting in this first set of data is that overall my students do see me as a fair teachers (60% of them were Agree or Strongly Agree, while 29% were neutral). When disaggregated, things get more interesting. When taking into account separate subject areas, my Geometry students thought I was a fairer teacher (75% Agree or Strongly Agree) than my Algebra 1 students (50% Agree or Strongly Agree). Perhaps it is because I have fewer Geometry students and I knew many of them because I had taught them last year. Or perhaps it is because the 9th grade students are younger and are transitioning into high school. I am open to any and all thoughts. This next chart is quite important - I want to make sure my students feel respected by me. Luckily - they do. Overall, 76% of my students feel that I respect them. Or, in a better way, only 4% of them say I disrespect them. These pie charts tell a similar story as in the first question. None of my Geometry students feel I have disrespected them whereas 5.8% of my Algebra 1 students feel I do not afford them enough respect. The vast majority of my students think I try to help them in different ways. This is a great way for me to know that I am differentiated correctly. That being said, I still need to improve what I'm doing for the 9% of Disagree or Strongly Disagree and the 17% who answered Neutral. The nice thing about this question is that even disaggregating doesn't make that much of a difference. The vast majority of my students still feel I offer different types of assistance. Finally, any teacher will want to make sure their students feel safe in his or her classroom. I am glad to see the vast majority of my students feel it is safe and only 2% were in the Disagree or Strongly Disagree camps. I am admittedly confused by those who were Neutral, but I suppose some people don't want to express opinions widely. There was a difference between my Geometry and Algebra 1 students in this regard, for some reason, but not related to the Disagree or Strongly Disagree numbers. Still 99% of my students did not Disagree to this statement.
These sets of data are a great way to understand how your students feel about you and what you need to do to change for the better. I think I will try to understand my 9th grade students more and have discussions with them about what is considered fair or not in order to change those statistics for the better.
0 Comments
Your comment will be posted after it is approved.
Leave a Reply. |
AuthorI am a math teacher in the New York Department of Education. I infuse technology and real-world problems into my curriculum in order to prepare my students for the future. I would love for people across the country to recognize we teachers can't do it alone. If you don't believe me, come visit my classroom! Contact MeEmail UpdatesArchives
March 2022
|