|
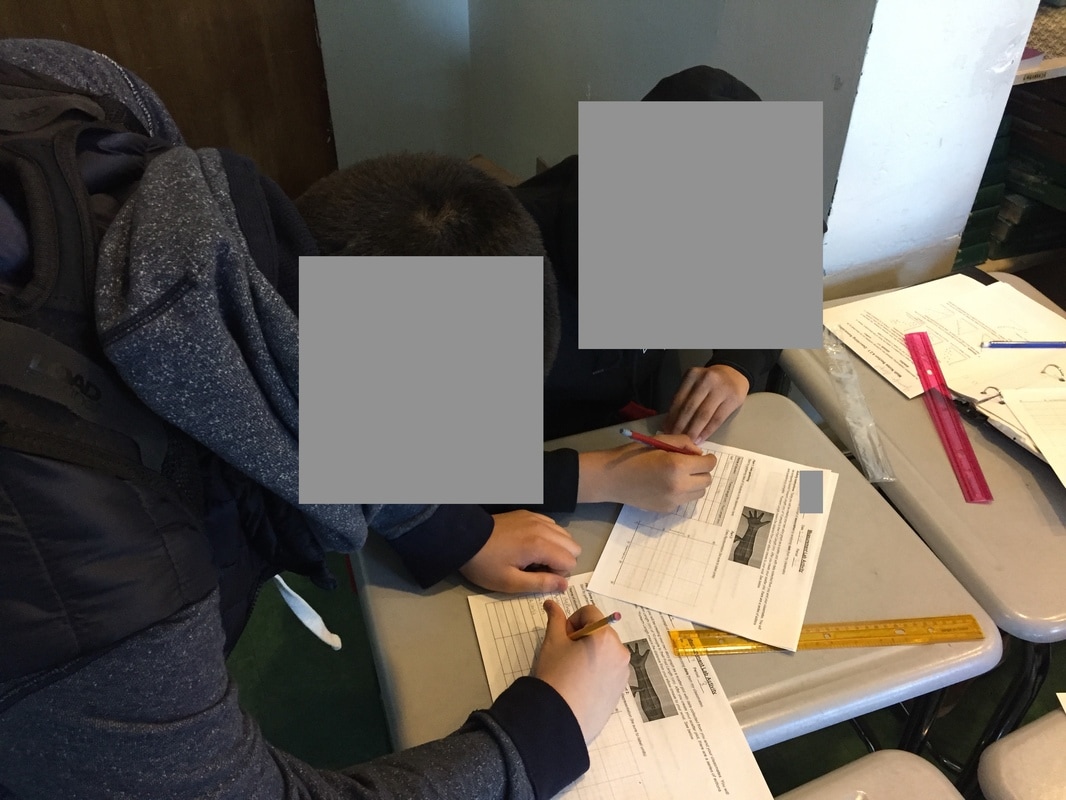
In our new semester of Algebra 1 we are starting with an analysis of how data is collected and represented in the world. The first day of the unit saw students measuring their foot length and forearms, sharing their data, and making scatter plots to describe the patterns they noticed. This will continue with learning about residuals, outliers, and how to calculate lines of best fit using linear regression modeling programs. Then, students will collect their own data to eventually showcase to the outside world. Very excited stuff!
0 Comments
Your comment will be posted after it is approved.
Leave a Reply. |
AuthorI am a math teacher in the New York Department of Education. I infuse technology and real-world problems into my curriculum in order to prepare my students for the future. I would love for people across the country to recognize we teachers can't do it alone. If you don't believe me, come visit my classroom! Contact MeEmail UpdatesArchives
March 2022
|


 RSS Feed
